How to solve the Apriori algorithm in a simple way from scratch?

Note: All the contents of the images, including tables and calculations and codes have been investigated by me and there is no need to refer any references for them.
Introduction
There are several methods for machine learning such as association, correlation, classification & clustering, this tutorial primarily focuses on learning using association rules. By association rules, we identify the set of items or attributes that occur together in a table[1].
Association Rule Learning
The association rule learning is one of the very important concepts of machine learning, and it is employed in Market Basket analysis, Web usage mining, continuous production, etc. Here market basket analysis is a technique used by the various big retailer to discover the associations between items. We can understand it by taking an example of a supermarket, as in a supermarket, all products that are purchased together are put together[2].
Association rule learning can be divided into three types of algorithms[2]:
- Apriori
- Eclat
- F-P Growth Algorithm
Introduction to APRIORI
Apriori is an algorithm used for Association Rule learning. It searches for a series of frequent sets of items in the datasets. It builds on associations and correlations between the itemsets. It is the algorithm behind “You may also like” that you commonly saw in recommendation platforms[3].

What is an Apriori algorithm?
Apriori algorithm assumes that any subset of a frequent itemset must be frequent. Say, a transaction containing {milk, eggs, bread} also contains {eggs, bread}. So, according to the principle of Apriori, if {milk, eggs, bread} is frequent, then {eggs, bread} must also be frequent [4].
How Does the Apriori Algorithm Work?
In order to select the interesting rules out of multiple possible rules from this small business scenario, we will be using the following measures[4]:
- Support
- Confidence
- Lift
- Conviction

Support
Support of item x is nothing but the ratio of the number of transactions in which item x appears to the total number of transactions.
Confidence
Confidence (x => y) signifies the likelihood of the item y being purchased when item x is purchased. This method takes into account the popularity of item x.
Lift
Lift (x => y) is nothing but the ‘interestingness’ or the likelihood of the item y being purchased when item x is sold. Unlike confidence (x => y), this method takes into account the popularity of the item y.
- Lift (x => y) = 1 means that there is no correlation within the itemset.
- Lift (x => y) > 1 means that there is a positive correlation within the itemset, i.e., products in the itemset, x and y, are more likely to be bought together.
- Lift (x => y) < 1 means that there is a negative correlation within the itemset, i.e., products in itemset, x and y, are unlikely to be bought together.
Conviction
Conviction of a rule can be defined as follows:

Its value range is [0, +∞].
- Conv(x => y) = 1 means that x has no relation with y.
- Greater the conviction higher the interest in the rule.

Now, we want to solve a problem of the Apriori algorithm in a simple way:
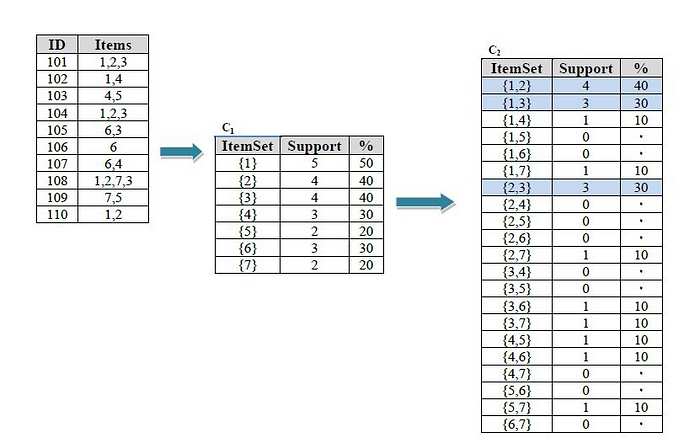
Part(a): Apply the Apriori algorithm to the following data set:

Step-1:
In the first step, we index the data and then calculate the support for each one, if support was less than the minimum value we eliminate that from the table.

Step-2:
Calculate the support for each one

Step-3:
Continue to calculate the support and select the best answer

Part(b): Show two rules that have a confidence of 70% or greater for an itemset containing three items from part a.
Step-1:
Calculate the confidence and follow the rules of question in part(b)

Step-2:
In addition to the above rules, the following can also be considered, but in the question only two rules are required for calculation.

Hands-on: Apriori Algorithm in Python- Market Basket Analysis
Problem Statement:
For the implementation of the Apriori algorithm, we are using data collected from a SuperMarket, where each row indicates all the items purchased in a particular transaction.
The manager of a retail store is trying to find out an association rule between items, to figure out which items are more often bought together so that he can keep the items together in order to increase sales.
The dataset has 7,500 entries. Drive link to download dataset[4][6].
Environment Setup:
Before we move forward, we need to install the ‘apyori’ package first on command prompt.

Market Basket Analysis Implementation within Python
With the help of the apyori package, we will be implementing the Apriori algorithm in order to help the manager in market basket analysis [4].

Step-1: We import the necessary libraries required for the implementation
import numpy as np
import matplotlib.pyplot as plt
import pandas as pd
Step-2: Load the dataset
Now we have to proceed by reading the dataset we have, that is in a csv format. We do that using pandas module’s read_csv function [6].
dataset = pd.read_csv("Market_Basket_Optimisation.csv")Step-3: Take a glance at the records
dataset
Step-4: Look at the shape
dataset.shape
Step-5: Convert Pandas DataFrame into a list of lists
transactions = []
for i in range(0, 7501):
 transactions.append([str(dataset.values[i,j]) for j in range(0,20)])
Step-6: Build the Apriori model
We import the apriori function from the apyori module. We store the resulting output from apriori function in the ‘rules’ variable.
To the apriori function, we pass 6 parameters:
- The transactions List as the main inputs
- Minimum support, which we set as 0.003 We get that value by considering that a product should appear at least in 3 transactions in a day. Our data is collected over a week. Hence, the support value should be 3*7/7500 = 0.0028
- Minimum confidence, which we choose to be 0.2 (obtained over-analyzing various results)
- Minimum lift, which we’ve set to 3
- Minimum Length is set to 2, as we are calculating the lift values for buying an item B given another item A is bought, so we take 2 items into consideration.
- Minimum Length is set to 2 using the same logic[6].
from apyori import apriori
rules = apriori(transactions = transactions, min_support = 0.003, min_cinfidence = 0.2, min_lift = 3, min_length = 2, max_length = 2)
Step-7: Print out the number of rules as list
results = list(rules)Step-8: Have a glance at the rules
results

Step-9: Visualizing the results
In the LHS variable, we store the first item from all the results, from which we obtain the second item that is bought after that item is already bought, which is now stored in the RHS variable.
The supports, confidences and lifts store all the support, confidence and lift values from the results [6].
def inspect(results):
    lhs         =[tuple(result[2][0][0])[0] for result in results]
    rhs         =[tuple(result[2][0][1])[0] for result in results]
    supports    =[result[1] for result in results]
    confidences =[result[2][0][2] for result in results]
    lifts        =[result[2][0][3] for result in results]
    return list (zip(lhs, rhs, supports, confidences, lifts))
resultsinDataFrame = pd.DataFrame(inspect(results), columns = ["Left hand side", "Right hand side", "Support", "Confidence", "Lift"])
Finally, we store these variables into one dataframe, so that they are easier to visualize.
resultsinDataFrame
Now, we sort these final outputs in the descending order of lifts.
resultsinDataFrame.nlargest(n = 10, columns = "Lift")
This is the final result of our apriori implementation in python. The SuperMarket will use this data to boost their sales and prioritize giving offers on the pair of items with greater Lift values [6].
Why Apriori?
- It is an easy-to-implement and easy-to-understand algorithm.
- It can be easily implemented on large datasets.
Limitations of Apriori Algorithm
Despite being a simple one, Apriori algorithms have some limitations including:
- Waste of time when it comes to handling a large number of candidates with frequent itemsets.
- The efficiency of this algorithm goes down when there is a large number of transactions going on through a limited memory capacity.
- Required high computation power and need to scan the entire database[4].
Summary

Association rule learning is a type of unsupervised learning technique that checks for the dependency of one data item on another data item and maps accordingly so that it can be more profitable. It tries to find some interesting relations or associations among the variables of the dataset. It is based on different rules to discover the interesting relations between variables in the database. The flowchart above will help summarize the entire working of the algorithm[2].
References:
[1] https://www.softwaretestinghelp.com/apriori-algorithm/
[2] https://www.javatpoint.com/association-rule-learning
[3] https://towardsdatascience.com/underrated-machine-learning- algorithms-apriori-1b1d7a8b7bc
[4] https://intellipaat.com/blog/data-science-apriori-algorithm/
[5] Patterns of user involvement in experiment-driven software development, authors.(S. Yaman), (F. Fagerholm), (M. Munezero), (T.Männistö).December 2019, https://www.journals.elsevier.com/information-and-software-technology
[6] https://djinit-ai.github.io/2020/09/22/apriori-algorithm.html#understanding-our-used-case
[7] https://www.datacamp.com/tutorial/market-basket-analysis-r


