Master InfluxDB: Setting Up A Plugin
If you haven’t read my blog introducing Time Series and InfluxDB, here it is so that you have a better idea of what we’ll be discussing on this article:
By the end of this article as a beginner, you would accomplish the goal of setting up Influxdb on your system, successfully running a plugin to generate a trigonometric function and view it on Chronograf just like you would plot sine or cosine waves against time on paper.

Install InfluxDB:
Head over to influxdb downloads, select your machine and go to your terminal to execute the command. I installed the lastest version v2.0.4 which in default has Chronograf and Telegraf, on my Ubuntu 20.04 machine.
$ https://dl.influxdata.com/influxdb/releases/influxdb2-2.0.4-amd64.deb
$ sudo dpkg -i influxdb2-2.0.4-amd64.deb
Once setting up is done, execute this command to check the status of Influxd. If it says active we are good to go!
$ sudo service influxd statusStart your influx service by typing in this command on terminal and head over to http://localhost:8086/ on your machine browser or http://<ipadress>:8086/ if you are using a cloud instance.
$ influxdIf you need to stop the service, you could use this command or replace stop with restart to do the latter.
$ sudo service influxd stopInstall Telegraf:
Head over to https://portal.influxdata.com/downloads/, choose your machine and download the latest version of telegraf on your machine.
For Linux binaries, I executed:
$ wget https://dl.influxdata.com/telegraf/releases/telegraf-1.17.3_linux_amd64.tar.gz
$ tar xf telegraf-1.17.3_linux_amd64.tar.gz
If you come across any errors in these steps, help is all around and I am sure it wouldn’t take much time.
Telegraf works on a plugin system where we have input plugins to collect data, output plugins to send data to a destination. Telegraf acts like a messenger to your final destination now that is, InfluxDB. Telegraf community has already built around 100+ plugin that we can use. Slight modifications to these plugins and we can view a lot of information on Influxdb.
We’ll first look at how to obtain these plugins and later work with the trigonometry plugin to plot a tangent and cosine wave with a given amplitude.
Get Plugins:
Before you get the plugins make sure you have installed Golang in your system with which all plugins are written.
You just need to simply execute these set of commands on your shell and you would have a directory with all the plugins that are available with telegraf:
$ go get github.com/influxdata/telegraf
$ cd <Path-to-go-directory>/github.com/influxdata/telegraf
$ make
This should return:
go mod download
go build -ldflags “ -X main.commit=9814d3d8 -X main.branch=random -X main.goos=linux -X main.goarch=amd64” ./cmd/telegraf
Alright! you are finally ready with all the plugins. To list/view all the plugins you can explore the commands with telegraf -h.
Now that we have all the ingredients with us, its time to finally plug & play with telegraf and view cool visualisations on Chronograf.
Editing Trig Plugin:
Open the file plugins in Go_directory>guthub.com>influxdata>telegraf and select inputs to view all the go files of input plugins. Open trig>trig_original.go. If you would like to replace the sine function with any other functions you can do so. I will be replacing sine with tan.
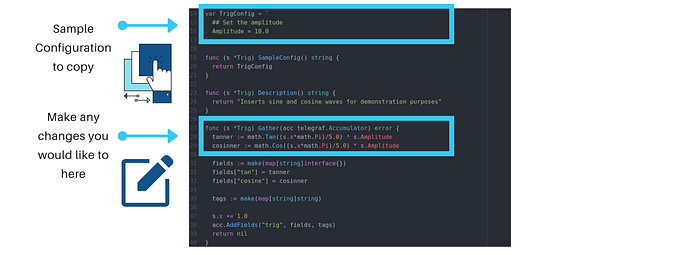
You’ll also be able to see a sample configuration format, which is necessary to push data into influx. This plugin allows user to change the amplitude of the function. Copy the sample configuration for now on your clipboard.
When you do make any changes to the plugins, to bring it in effect you should execute:
$ cd <Path-to-go-directory>/github.com/influxdata/telegraf
$ make
Finally, Chronograf:
Open your influxdb server which was running from the first step, make a bucket to flush data by heading to Data>Buckets>Create Bucket.
I will be naming mine ‘Trig’. Next head to Data>Telegraf>Create Configuration. Name the configuration something simple (trig), make sure to select the bucket you created and select the plugin ‘system’ to make a config. We’ll edit this to use the trig plugin to collect metrics. Click finish.
Select setup instructions next to the configuration you created and generate a token. A token lets you send data into the bucket through the plugin. Head to a new shell and paste the token you created by using:
$ export INFLUX_TOKEN=<TOKEN>You can click on the configuration file and now download it. Once you have downloaded open the file with a text editor and now paste the sample configuration from trig plugin while deleting all the other inputs. To add any inputs we should specify [[inputs.<inputname>]], in this case [[inputs.trig]].
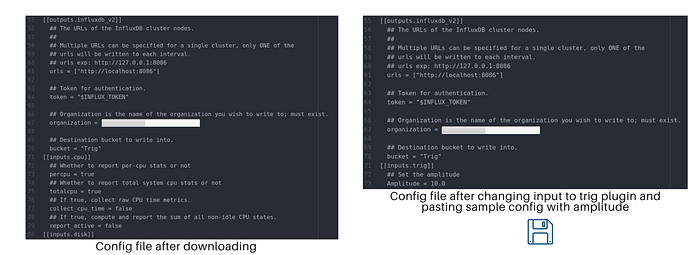
Save the file and now you are good to go. Open the shell where we earlier exported token and type in:
$ telegraf --config '<path to config file>/trig.conf' --debugNow, you’d get it successfully running on your shell if there are no errors. Open Chronograf>Explore>Choose your Bucket>Click the measurement>Submit.

There you go! You would see the plot against time of the waves on the Chronograf dashboard.
Hoping this article guided you to successfully complete the tasks. For more learning about TICK Stack, Stay Tuned!