Trading Cup and Handles With MarketSmith Pattern Recognition
Backtesting William O’Neil’s classic base pattern
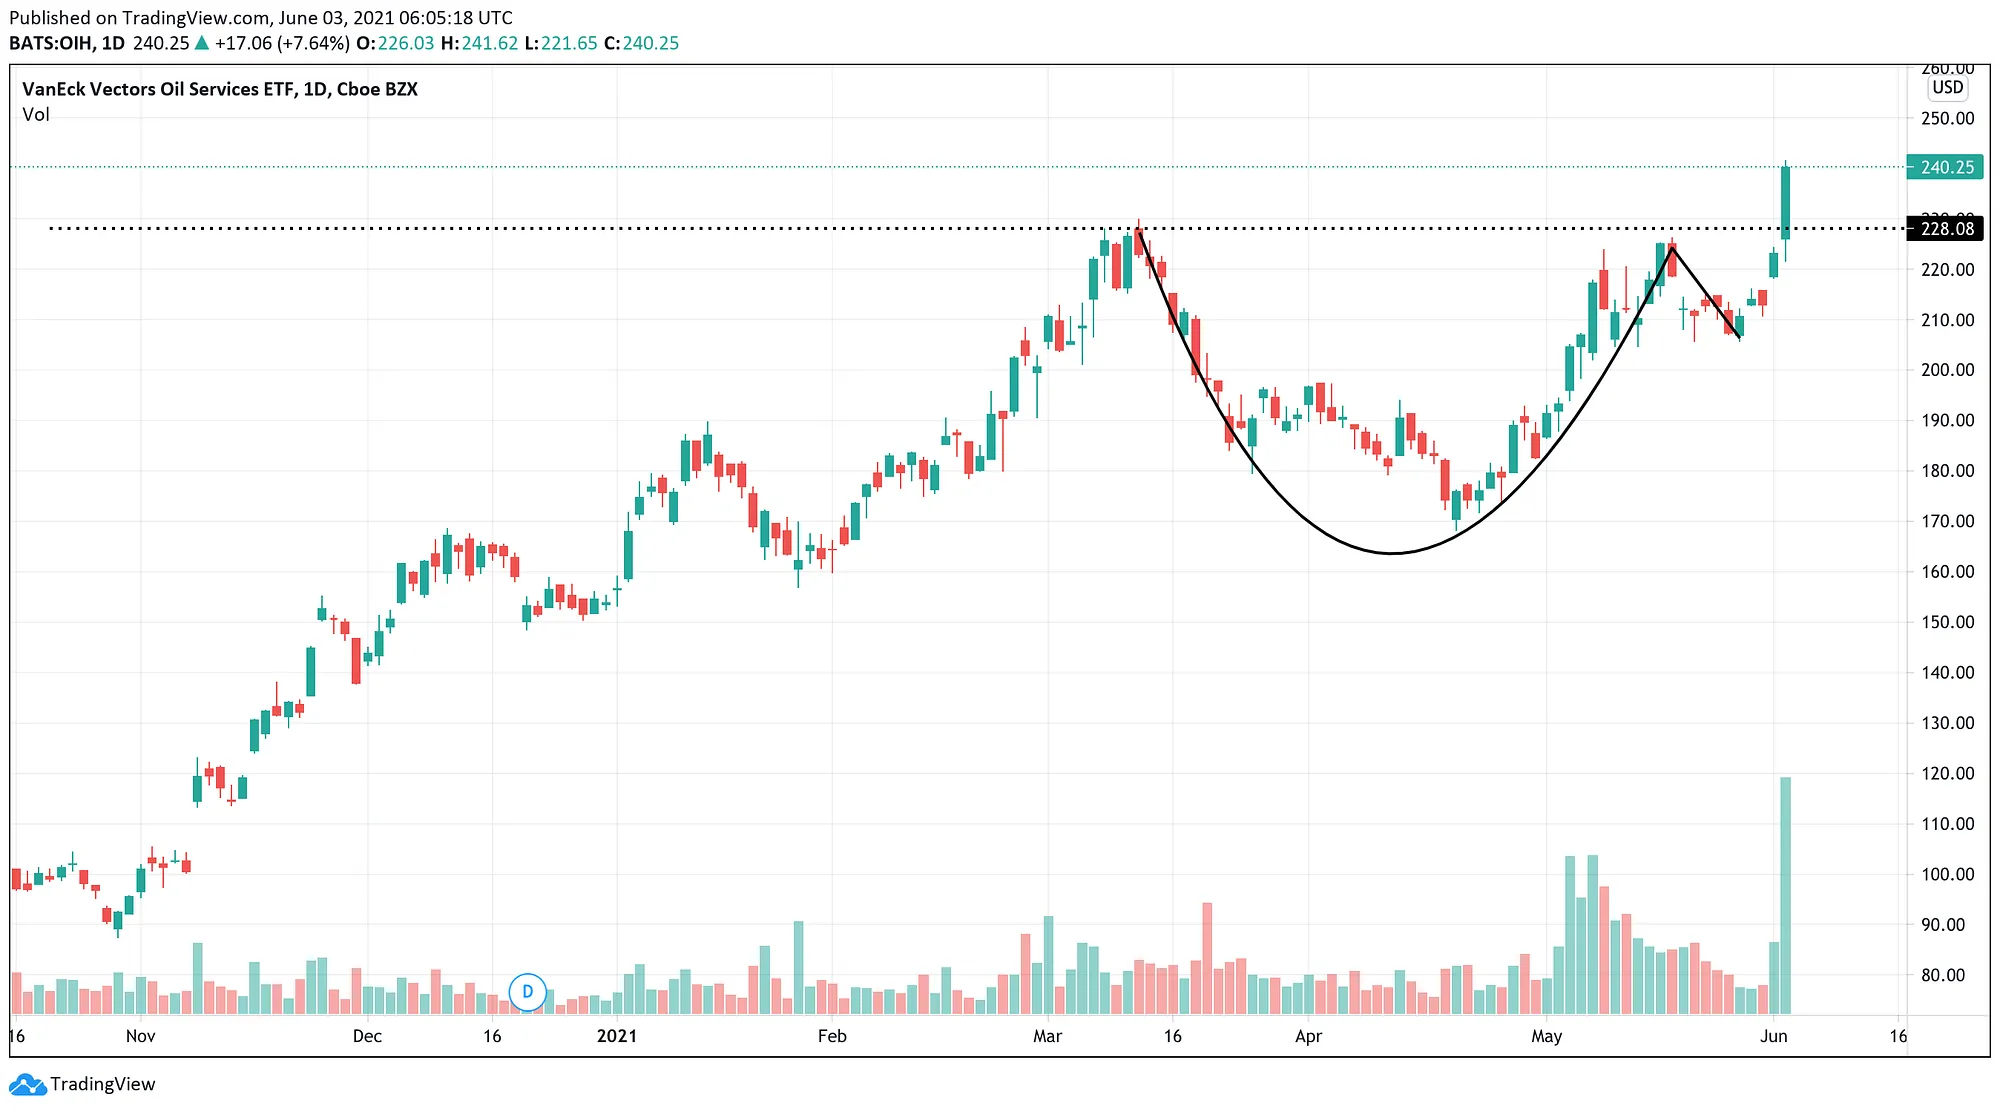
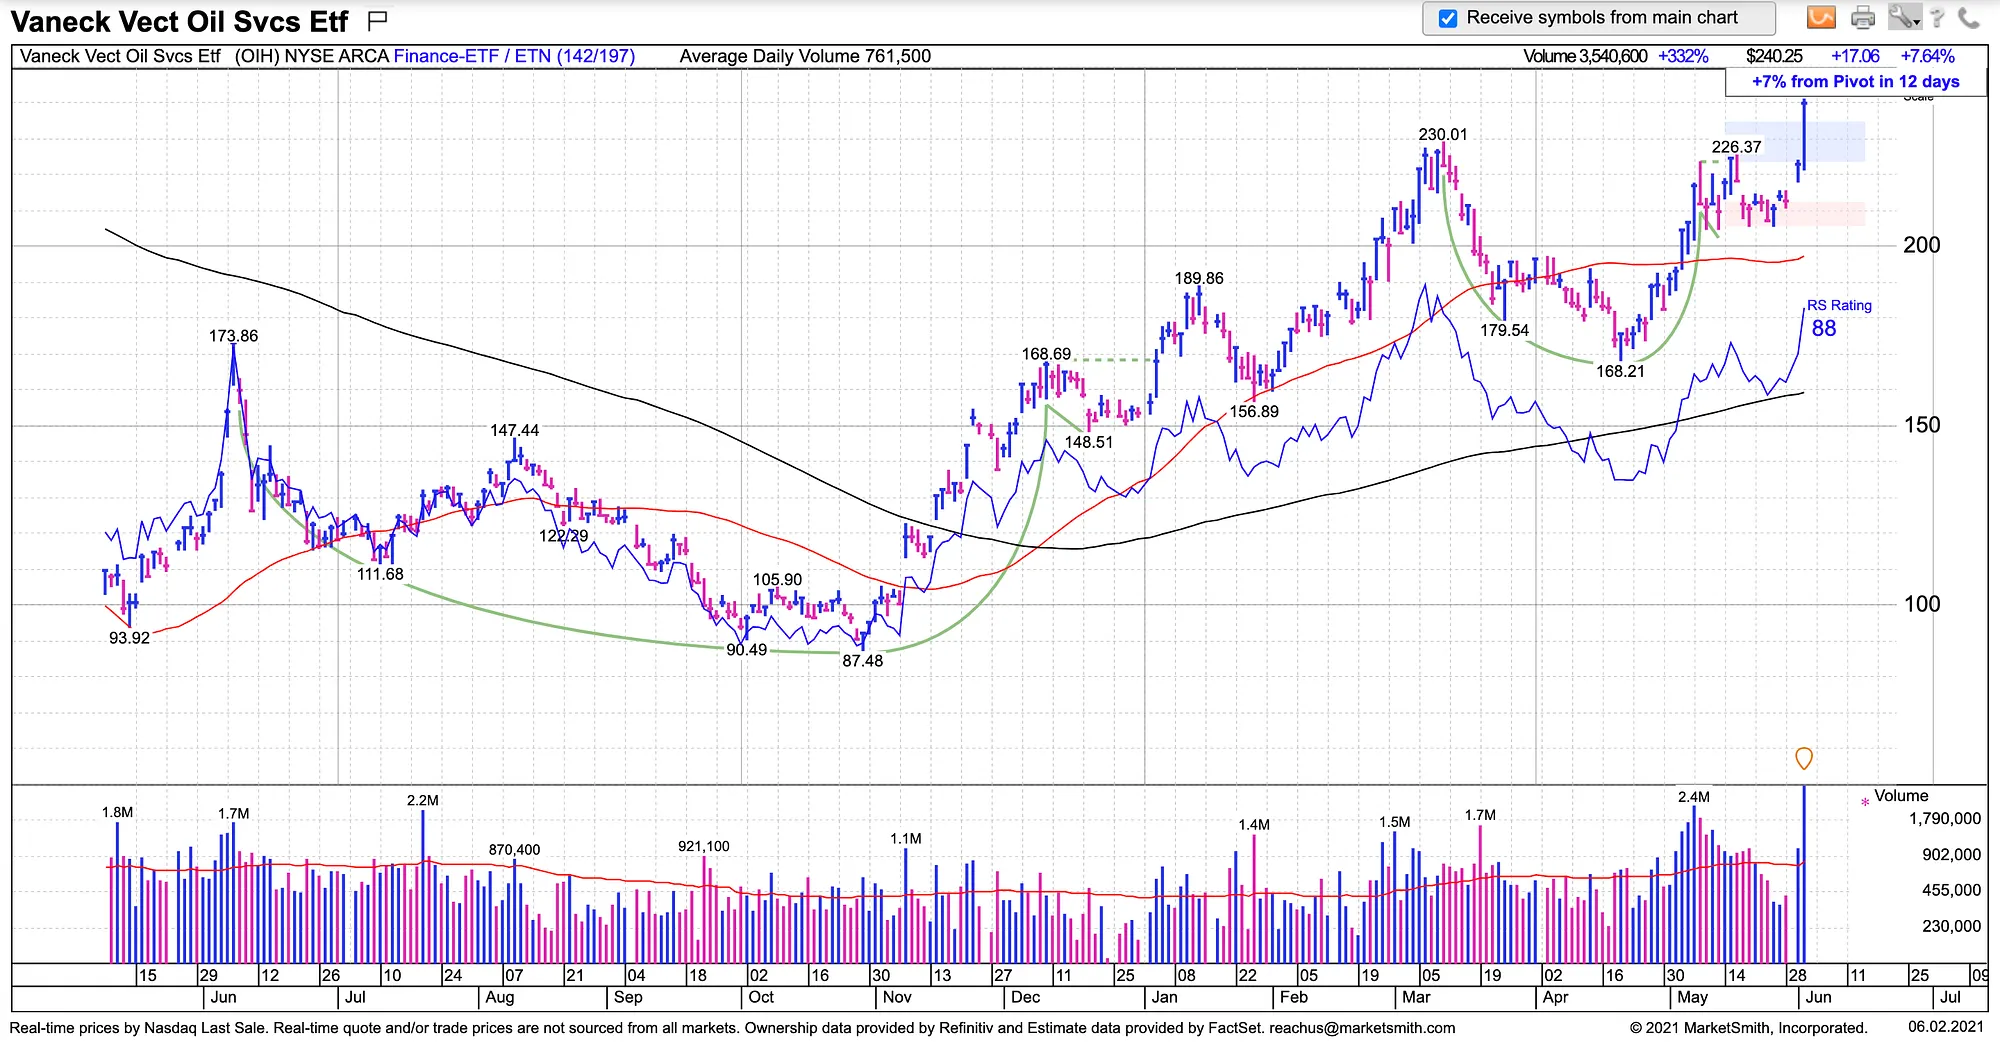
The Cup With Handle pattern, developed by William O’Neil, is a technical indicator for identifying the continuation of a trend after a period of consolidation. [1] It consists of an initial uptrend that’s ideally not too mature, a U-shaped move (cup), followed by another sharp and minor shake out (handle). The price, after a rally, starts to consolidate with a smooth slope but then bounces back to the previous highs as it faces support at lower price levels.
When previous highs are touched, investors who bought shares before consolidation and other less committed investors sell their shares, pushing the price down for one last time. Eventually, the price reverses from a second support level (above the previous one) and breaks out of the resistance. Traders use different rules to identify Cup With Handle patterns and gauge their strength, but the base usually lasts 6–65 weeks with depths ranging from 8% to 50%. When trading Cup With Handles, the profit target is usually 20–25% above the initial resistance (pivot point), and the stop-loss range is 5–8% below that line. [2]
Pattern Recognition, part of the IBD MarketSmith’s premium trading toolkit, identifies seven different chart patterns in daily and weekly time periods: Cup and Cup With Handle, Saucer and Saucer With Handle, Double Bottom, Flat Base, Ascending Base, Consolidation, and IPO Base. This article will focus on using Pattern Recognition API to identify and trade Cup With Handle patterns. To find more information about other properties of Pattern Recognition, check its user manual.
Prerequisites
A basic understanding of Python is needed to get the most out of the article. We’ll use pydantic to validate and serialize data, zipline-reloaded and pyfolio to backtest the strategy, pandas to load and access data, python-dotenv to read environment variables, yfinance to fetch benchmark price data, and requests to make API calls. A premium MarketSmith account is required to access Pattern Recognition. Symbols data and a list of Dow Jones Industrial Average (DJIA) constituents will be fetched from Financial Modeling Prep (FMP) v3 API. To retrieve the historical price data of the constituents, you need to ingest a zipline data bundle.
Please make sure to use the following versions:
python3.6.12pyfolio0.8.0pandas0.22.0matplotlib3.0.3numpy1.19.5
Alternatively, you need to follow this answer and update a line at pyfolio source code to make it work with the latest stack.
Load and Store Data
DJIA Constituents
With a free FMP account, we can access the list of DJIA names from this endpoint. First of all, create src/price/endpoints.py to store the FMP endpoints.
Define Constituent model to serialize data received from FMP API.
Define load_tickers to fetch and store data.
We first load FMP_API_KEY environment variable, pass it to the endpoint defined in constants.py and convert the response to a dictionary by calling the .json() method. We then use Pydantic’s parse_obj_as utility method to serialize response into a list of Constituent instances. In the end, the data is converted back to a list of dictionaries to be stored in data/tickers.csv .
Make sure to store theFMP_API_KEY key in the .env file and set it to the key you received from the FMP dashboard. Now we can dispatch load_tickers from the command line. If it runs properly, we’ll have a CSV file similar to the image below.

Cup With Handle Data
We should now load the history of Cup With Handle patterns for all symbols in data/tickers.csv . Let’s first define the MarketSmith endpoints we’re going to call.
AuthSession class passes environment variables to IBD API to generate an authenticated session.
We first send the user credentials to GET_LOGIN endpoint to receive the user object, which then will be passed (along with an extra action key) to HANDLE_LOGIN . The response includes the necessary Set-Cookie headers to authenticate the session for future requests. Don’t forget to define USERNAME , PASSWORD , and API_KEY values (according to your MarketSmith account credentials) in .env .
Before fetching patterns, we need to load Instrument and User objects. Let’s start with the latter. Define the User model to serialize the object we’ll receive from the MarketSmith backend.
get_user method receives an authenticated session and returns the authenticated user information.
validate_arguments decorator parses and validates arguments before the function is called. arbitrary_types_allowedparses arguments with an instance that don’t extend pydantic BaseModel class (in this case, an AuthSession instance).
It’s time to load instrument data from MS API.
MS API passes dates with this format: /Date(1536303600000–0700)/–the first number is the date in milliseconds since the epoch, and the second number is the timezone difference with GMT. convert_msdate_to_date method converts MS API date strings to the built-in datetime.date object.
get_instrument searches for a symbol in the MarketSmith database and then looks for an exact match in search results. If the number of exact matches for the symbol is not one, it raises AssertionError . In the end, it serializes the received dictionary into an Instrument instance.
We’re getting to the meat of the matter. Let’s load, parse, and store Cup With Handle patterns. First, define a model to serialize the data.
Next, we need a few methods to handle the extraction and storage of patterns.
get_patterns makes a request to the patterns endpoints and receives all chart patterns for an instrument during a certain period. Note that if you want to get patterns for the weekly chart, set frequency to 2.
MarketSmith passes a properties attribute with the instrument object that includes the instrument’s custom properties as a list. Since we only care about Cup With Handle patterns, and they share the same properties, we use flattern_pattern_properties to flatten the object by removing properties key and adding the elements of its list value to our initial instrument object.
filter_cup_with_handles receives a list of pattern objects and returns Cup With Handle patterns amongst them. One “gotcha” with this method is that MS passes Cup Without Handles and Cup With Handles under cupWithHandles key, but only those with a patternType of 1 are Cup With Handles (see lines 100–102 in the snippet above).
Finally, store_patterns receives a list of pattern instances and appends them to a local CSV file.
To wrap things up, write some controller functions to orchestrate all the previously defined methods.
convert_csv_to_records reads rows of a CSV file and serializes them with a pydantic model. We’ll later use it to read and parse the data in tickers.csv file.
extract_patterns receives a ticker, a filter method for a pattern type, start and end dates, and an authenticated session. It then orchestrates other methods to fetch and serialize filtered patterns.
extract_n_store_cup_with_handles accepts the start and end dates in milliseconds since the epoch with a list of Constituent objects, retrieves their cup with handle patterns, and stores those patterns in data/patterns.csv file. Now, call the method with the required arguments.
Awesome! We’re done with the data collection part. Let’s define a trading algorithm based on these patterns and evaluate the results.
Strategy
Create a Jupyter Notebook to develop, backtest, and analyze the strategy. First, import the requirements.
The algorithm, at each tick, loops through patterns, and if all of the following conditions are met, orders the asset:
- The current date has passed the
handleLowDateproperty of the object, but not by more than 30 days; - The current price has broken out of the pivot price level (the second high of the cup) by more than 1%;
- The 50-day simple moving average (SMA) is above the 200-day SMA.
The algorithm subsequently closes a position in any of these situations:
- The trade generated 15% profit or more;
- The trade led to a loss of 5% or more;
- Twenty-one days or more have been passed since the opening of the position.
We use SPY (S&P 500 Trust ETF) returns as the benchmark, run the algorithm from 2016 to 2018, and use ten million dollars of capital. Let’s store all these parameters in a cell to facilitate tweaking or optimizing them.
Before defining the logic, we need a utility function that makes date columns of a DataFrame timezone-aware, which allows us to compare dates in the patterns.csv file to zipline built-in dates.
Zipline requires two functions: initialize and handle_data. The former sets up the backtesting context by receiving an argument and adding global variables to it. The latter gets called at each ticker and accepts two arguments–context (the global context of the algorithm) and data that includes the information specific to the current tick–and makes trades based on the current market conditions. By hiding future price data, zipline ensures that there’s no look-ahead bias in the logic.
Note that zipline.api.symbol method receives a ticker and returns the corresponding Equity object.
First, data.history loads the price data of the stocks list for the past 200 trading days. Then the method loops through patterns and finds the instances that satisfy all the requirements and are not already in the portfolio. When opening a new position, the capital is re-allocated equally amongst all positions, using zp.api.order_target_percent. Eventually, the code stores the current date in context.position_dates dictionary for future reference. Finally, it loops over open positions and, if any sell requirements are satisfied, sells the asset.
Almost done. Define a method to fetch benchmark price data from yfinance and process it to the acceptable pyfolio format (a pandas Series with date index).
Note that returns are calculated by calling the pct_change method on the Close column of the price history dataframe. Now we need to handle the analysis of the algorithm.
analyze receives two arguments: perf , the return value of zipline run_algorithm function, and bench , the benchmark returns retrieved from the previously defined method. pf.utils.extract_rets_pos_txn_from_zipline extracts daily returns, positions history, and the list of all transactions made by the algorithm from the performance dataframe. We pass benchmark and backtest returns to pf.create_full_tear_sheet to generate a comprehensive strategy analysis. In the end, let’s call run_algorithm and inspect the results. Make sure to convert start and end dates to a localized pandas Timestamp object.
Results
It’s time to receive our just deserts. After running the analyze method, pyfolio generates a tear sheet that includes several tables and charts to present a detailed analysis of the results.
With 0.08 alpha and 0.1 beta, the strategy seems too passive, which could be improved by increasing the number of watchlist stocks. But the risk-return measures of the strategy look solid — notably, Sharpe, Sortino, and Calmar ratios display acceptable returns given the low exposure. You can find the full tear sheet of the strategy results below.

Improvements
The strategy could be enhanced in many ways; let’s discuss some of them.
- % of up bars: by taking the ratio of green bars to red bars during the pattern formation, particularly in the latter half of the cup, we can gauge the strength of the bullish pattern and the potential breakout.
- % of up volume: similarly, showing above-average volume during up days (skyscrapers of accumulation) may confirm that institutions are interested in the asset. [3]
- Volume on breakout: another solution could be to buy the name when the volume is above average on the breakout day.
- The volatility of the cup: the cup shouldn’t be nasty and V-shaped; using the Average True Range or standard deviation of the price action, we can gauge the smoothness of the price movement while forming the cup pattern. [4]
- Prior uptrend strength: by making sure that the pattern follows a strong and established uptrend, using the height and length of the rally, we can ensure that a strong move backs the base.
[1] D. Saito-Chung, When To Buy The Best Growth Stocks: How To Analyze A Stock’s Cup With Handle (2020), Investor’s Business Daily
[2] Cup With Handle, StockCharts ChartSchool
[3] S. Lehtonen, Roku, One Of The Top Stocks Of 2019, Built ‘Skyscrapers’ Of Accumulation Before A Breakout (2019), Investor’s Business Daily
[4] W. J. O’Neill, How to Make Money in Stocks: A Winning System in Good Times and Bad (2009)
You can find the source code here.